Published at Jun 17, 2026
The best batteries for trail cameras: we lab-tested 12 types
Bad batteries in a trail camera mean a camera that dies too soon, missed footage, and extra trips into the field. When the camera is somewhere hard to reach, or you don’t want to check it every two weeks, battery runtime is what matters.
This question has always interested us, because losing footage for no good reason matters to us. That’s why we tested trail camera batteries back in 2022, at that point still empirically: how many days a camera lasted in the field on a given set of cells. It gave us a practical feel for it, but field runtime has too many variables to pin down an exact number. The precise number of triggers, the strength of the IR illumination depending on how far the subject is from the camera… each one blurred the result a little. On top of that, and this is the main reason we came back to the topic, new technologies and new products have reached the market. A lot of what held true in 2022 is different today. So we changed our own choice for large-scale trail-camera monitoring too.
To get a more accurate picture of how each battery performs, we did it differently this time. We discharged every cell on a lab electronic load at constant power, following a profile derived from a trail camera’s real draw, and measured the actual energy delivered, in watt-hours (Wh).
So this article is the lab follow-up to our older 2022 field test. A figure in Wh measured in a lab can sound abstract. In practice, what we care about is days in the forest or the number of clips captured. But these measured values are the best common yardstick we have across different battery types. The manufacturer’s spec and reality are two different things, and with trail camera batteries that goes double, because what’s printed on the wrapper is rarely what we actually measured.
The verdict: which battery to pick
There is no absolute winner, because the right battery depends on how you use the camera. So we split the verdict by situation. All figures are measured at a 0.5 W load (very close to what a camera pulls while recording video at night) per cell down to 1 V, at room temperature (≈23 °C).


Why these:
- Maximum power and runtime - Energizer Ultimate Lithium: a measured 4.31 Wh per cell, clearly the most in the whole test (≈18% above the best rechargeable and around 3.5× the alkalines). Single-use and pricier, but unbeaten on runtime and shelf life, ideal for critical, hard-to-reach deployments.
- High output and long-term economy - XTAR AA CLR 4300: 3.66 Wh per cell, the most of any rechargeable. The pick if you don’t check the camera often, or if you want a safety margin against an unexpected wave of triggers: more energy = it lasts longer regardless of activity.
- Frequent checks and a focus on price - Eneloop: proven NiMH at a sensible price. If you visit the camera regularly anyway, you won’t use the XTAR’s higher capacity, and Eneloops are plenty. The cheaper Eneloop (white) are fine for normal use; Eneloop Pro have higher capacity when you want a bit more runtime at a still-comfortable price.
- Most convenient - Browning Li-ion pack: one rechargeable unit (USB-C) instead of eight loose AAs, 25.8 Wh for the whole pack. A fast, easy swap, with no clicking cells in and out with frozen fingers. On raw energy, though, the best eight AAs beat it.
- Alkalines (Varta, Lidl) - generally not recommended: under a real night load they delivered only around 46% of their rating. They make sense only in specific cases: short deployments, photos only.
Results: how much energy the cells actually delivered
The figures below are measured, not copied off the wrapper, and that’s exactly why they’re interesting.
| # | Battery | Chemistry | Rated | Measured (Wh) | % of rating | 8× set (Wh) | Indicative price* |
|---|---|---|---|---|---|---|---|
| 1. | Energizer Ultimate Lithium | Li-FeS2 | 3500 mAh | 4.31 | ≈91% mAh | 34.5 | ≈ €18 |
| 2. | XTAR AA CLR 4300 (navy) | reg. Li-ion | 4.3 Wh | 3.66 | 85% | 29.3 | €38 |
| 3. | XTAR AA 4150 (blue) | reg. Li-ion | 4.15 Wh | 3.37 | 81% | 27.0 | ≈€40 |
| 4. | Browning pack | Li-ion pack | 24.42 Wh | 25.8 / pack | ≈106% | 25.8 | €43 / pack |
| 5. | XTAR AA 3300 (white) | reg. Li-ion | 3.3 Wh | 3.09 | 94% | 24.7 | ≈€32 |
| 6. | AlzaPower (NiMH) | Ni-MH | 2500 mAh | 2.94 | ≈98% mAh | 23.5 | ≈€16 |
| 7. | Eneloop Pro | Ni-MH | 2500 mAh | 2.92 | ≈95% mAh | 23.4 | €40 |
| 8. | GP ReCyko silver | Ni-MH | 2600 mAh | 2.90 | ≈91% mAh | 23.2 | ≈€32 |
| 9. | Eneloop white | Ni-MH | 2000 mAh | 2.34 | ≈96% mAh | 18.7 | €34 |
| 10. | GP ReCyko Pro | Ni-MH | 2000 mAh | 2.23 | ≈93% mAh | 17.9 | ≈€20 |
| 11. | Varta alkaline | Zn-MnO2 | 2306 mAh | 1.24 | ≈46% mAh | 9.9 | €4.50 |
| 12. | Lidl Tronic alkaline | Zn-MnO2 | no figure | 1.22 | low | 9.7 | ≈€3 |
*Indicative price for an eight-cell set (Browning per single pack), prices as of June 2026. The rated energy for XTAR and Browning is converted to Wh so it’s directly comparable with the measured values; for NiMH, lithium and alkaline cells the manufacturer states charge in mAh.
How much energy the cells really delivered
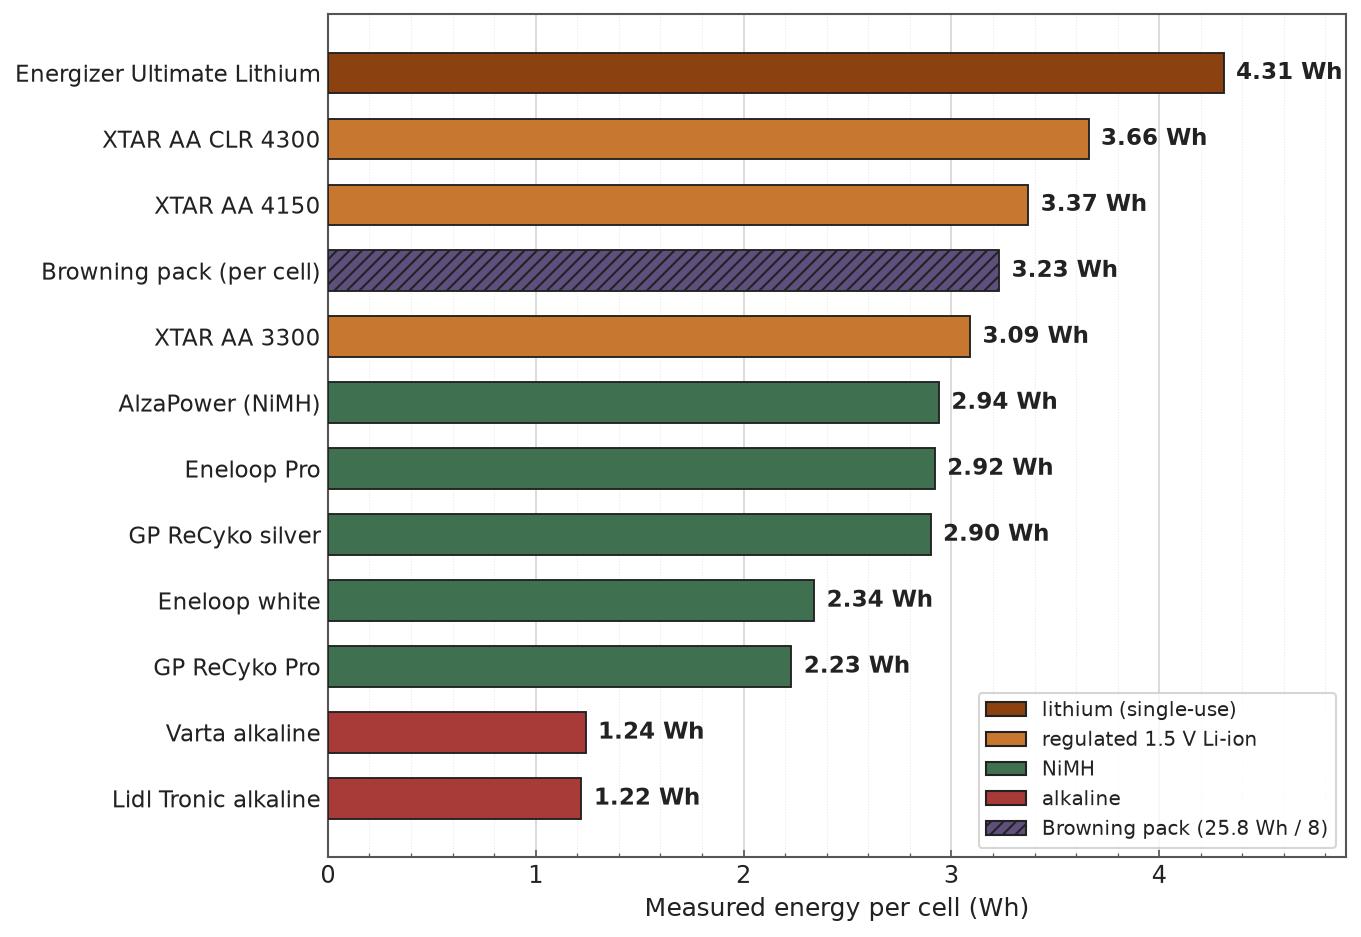
Measured energy delivered per cell at a 0.5 W load per cell, 1 V cut-off and room temperature ≈23 °C. The Browning pack is normalized to one of eight cells.
Three things from the table are worth highlighting, because they’re exactly what the wrapper won’t tell you:
- Alkalines collapse to ≈46% of their rated capacity under load. It isn’t a faulty unit, it’s physics (we explain it below).
- XTAR delivers only 81 to 85% of its rated mWh. Not necessarily because it’s lying, but because the number on the wrapper is the energy of the internal cell, not what comes out at the terminals (they picked the number that looks better).
- NiMH delivered almost exactly what they promise. Eneloop, GP ReCyko Pro and AlzaPower all landed around 93 to 98% of rated mAh, so with this chemistry the figure on the wrapper is pretty much right.
One note on everything below: we measured at room temperature. A cold-weather test is in preparation as a separate piece, and we expect the order to shift in it.
What exactly we tested
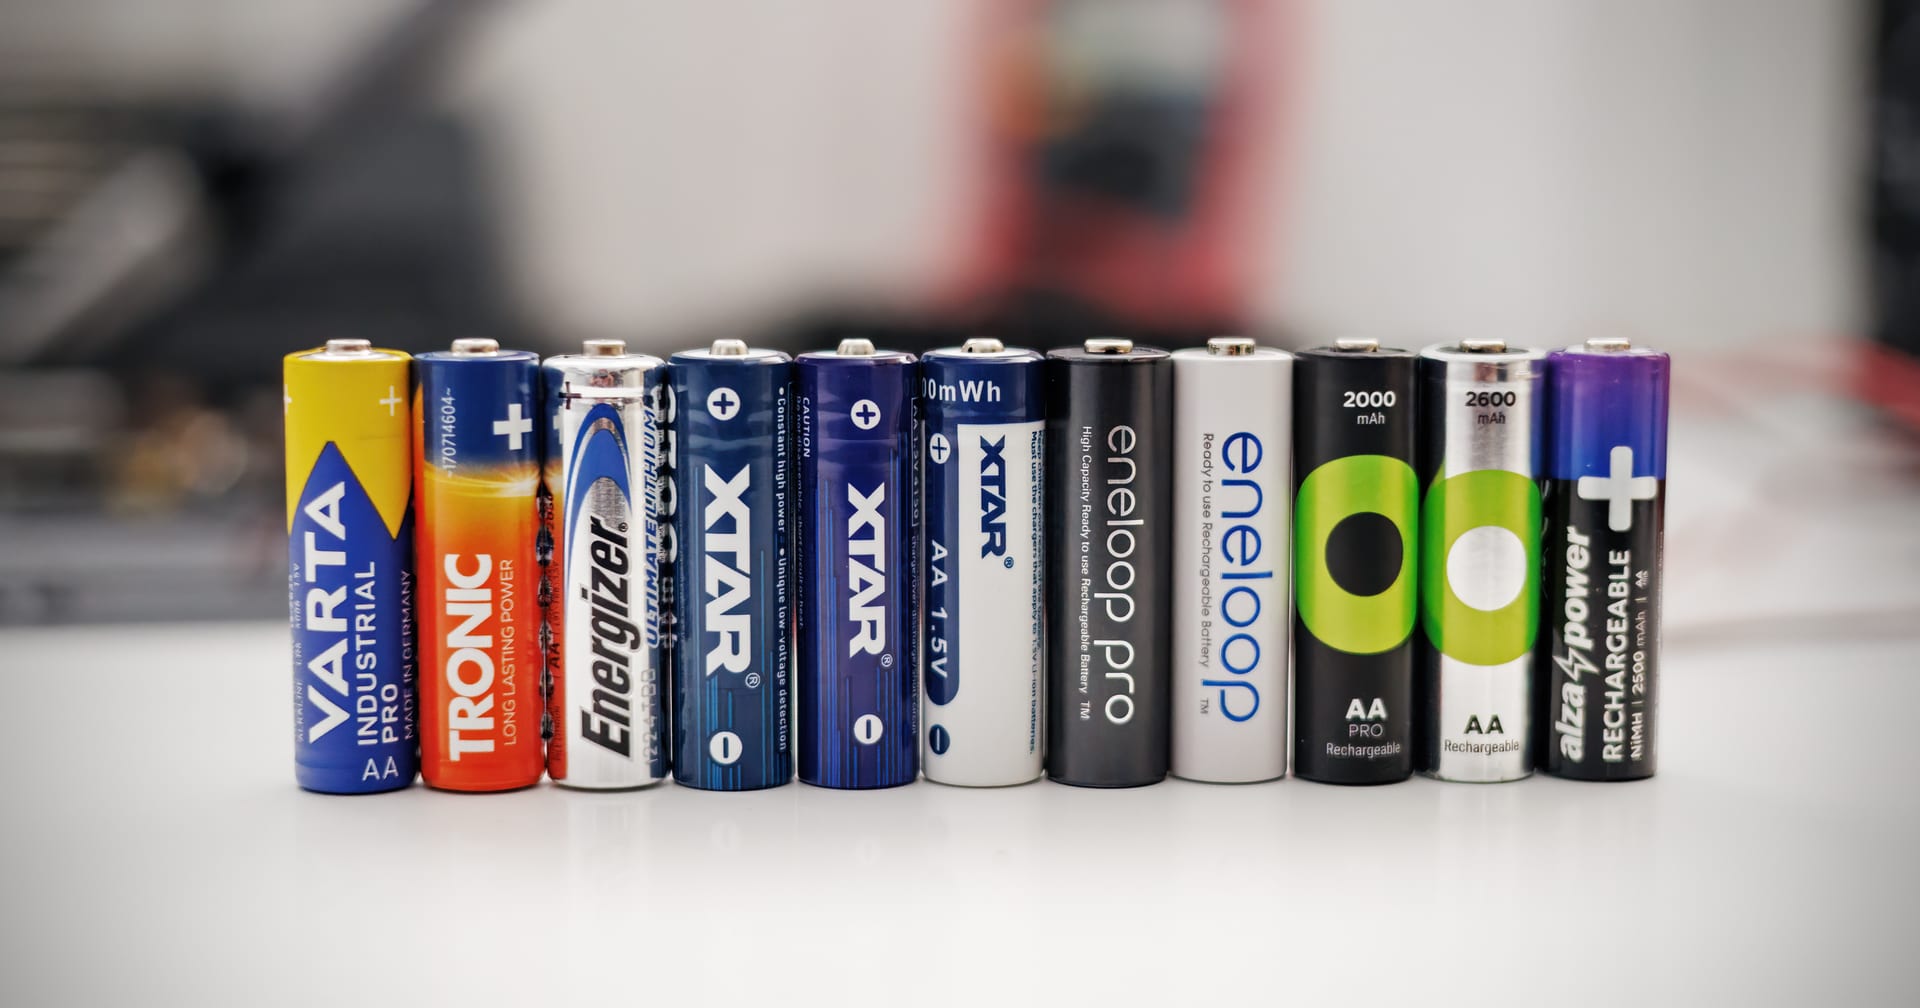
We put eleven types of AA cell and one Browning Li-ion pack into the test, so twelve candidates in total. We compared the real delivered energy a trail camera can actually use. We handle the Browning pack separately, because it isn’t an ordinary AA cell but a standalone unit that replaces the whole tray of eight AAs in a Browning.
We split the cells into four groups plus the pack as a special case:
- Single-use alkaline: Varta, Lidl Tronic.
- Single-use lithium: Energizer Ultimate Lithium (L91, Li-FeS2 chemistry).
- Rechargeable NiMH: Panasonic Eneloop (white), Eneloop Pro, GP ReCyko (silver), GP ReCyko Pro, AlzaPower (NiMH).
- Regulated 1.5 V Li-ion AA: three XTAR models.
- Special: the Browning Li-ion pack for HP4, HP5 and HP5 Ultra (A152-04), rechargeable over USB-C.
One warning on AlzaPower: two completely different battery types are sold under the same name, and it’s easy to grab the wrong one. We tested the rechargeable NiMH cell, AlzaPower Rechargeable HR6 (AA) 2500 mAh in the black-and-purple packaging, not the single-use AlzaPower Super Alkaline. Every “AlzaPower” result in this test refers to that rechargeable version.
A clarification on XTAR is useful too, because its labeling is confusing: the number in the model name is the rated energy in mWh, not capacity in mAh. Here are the three models we tested:
| Model | Colour | Rated (Wh) | Measured (Wh) | % of rating |
|---|---|---|---|---|
| XTAR AA CLR 4300 | navy | 4.3 | 3.66 | 85% |
| XTAR AA 4150 | blue | 4.15 | 3.37 | 81% |
| XTAR AA 3300 | white | 3.3 | 3.09 | 94% |
The measured values are lower than the rated mWh - we explain why below, in the section on XTAR’s internal converter.

We measured every cell type four times - two physical units on two different electronic loads. That ruled out random inaccuracies and any single faulty unit.
Why we measure Wh, not just Ah
Most battery comparisons use mAh (1000 mAh = 1 Ah). Within one technology (the same internal build and behavior), that makes sense, but when you compare different technologies, it misleads.

We measured the energy directly on the electronic load, the real draw a trail camera would pull from the cell. No theoretical conversion from mAh, just a practical measurement of delivered watt-hours.
Ah is a unit of electric charge, meaning current times time. It tells you how many electrons the cell pumps through, but says nothing about the voltage at which it pumps them. Wh is a unit of energy, meaning power times time, or put simply, charge times voltage (Wh = V × Ah). And since a trail camera consumes watts, its runtime is set by energy, not charge alone.
The difference is easy to show with numbers. Picture two cells, both 2000 mAh:
- A NiMH cell at 1.2 V stores roughly 2000 mAh × 1.2 = 2400 mWh (2.4 Wh).
- A regulated 1.5 V cell at 1.5 V stores roughly 2000 mAh × 1.5 = 3000 mWh (3.0 Wh).
Same charge, but the 1.5 V cell carries 25% more energy, because every coulomb delivers its energy at a higher voltage. Comparing a NiMH and a 1.5 V cell on mAh alone therefore understates how much voltage matters.
And the Browning pack? It runs at a completely different nominal voltage (11.1 V) than an AA cell. Comparing it with AAs on mAh would make no sense at all. Wh is the only common unit that keeps the whole test comparable. That’s why everything from here on is ranked by Wh per cell and Wh per eight-cell set.
A bit of physics: voltage, current and constant power
AA cells don’t have one fixed voltage, and that’s exactly why the results don’t make sense without this explanation. Fresh alkalines sit around 1.5 V. Single-use lithium (Li-FeS2) is also nominally 1.5 V, but fresh and lightly loaded it climbs higher, toward 1.8 V (our Energizer measured 1.81 V at full charge, which is the real open-circuit voltage of this chemistry, not a measurement error). NiMH is nominally 1.2 V, around 1.4 V fresh off the charger. Regulated XTARs hold a flat ≈1.5 V.
We watched the cell voltage during discharge directly at the terminals, because that is what determines how much energy you actually get out of the charge.
In an eight-cell set wired in series (the way they’re most often connected in trail cameras), the voltages add up. With fresh alkalines or lithium, the working voltage of the whole set is over 12 V and gradually falls toward around 8 V, where the camera shuts off.
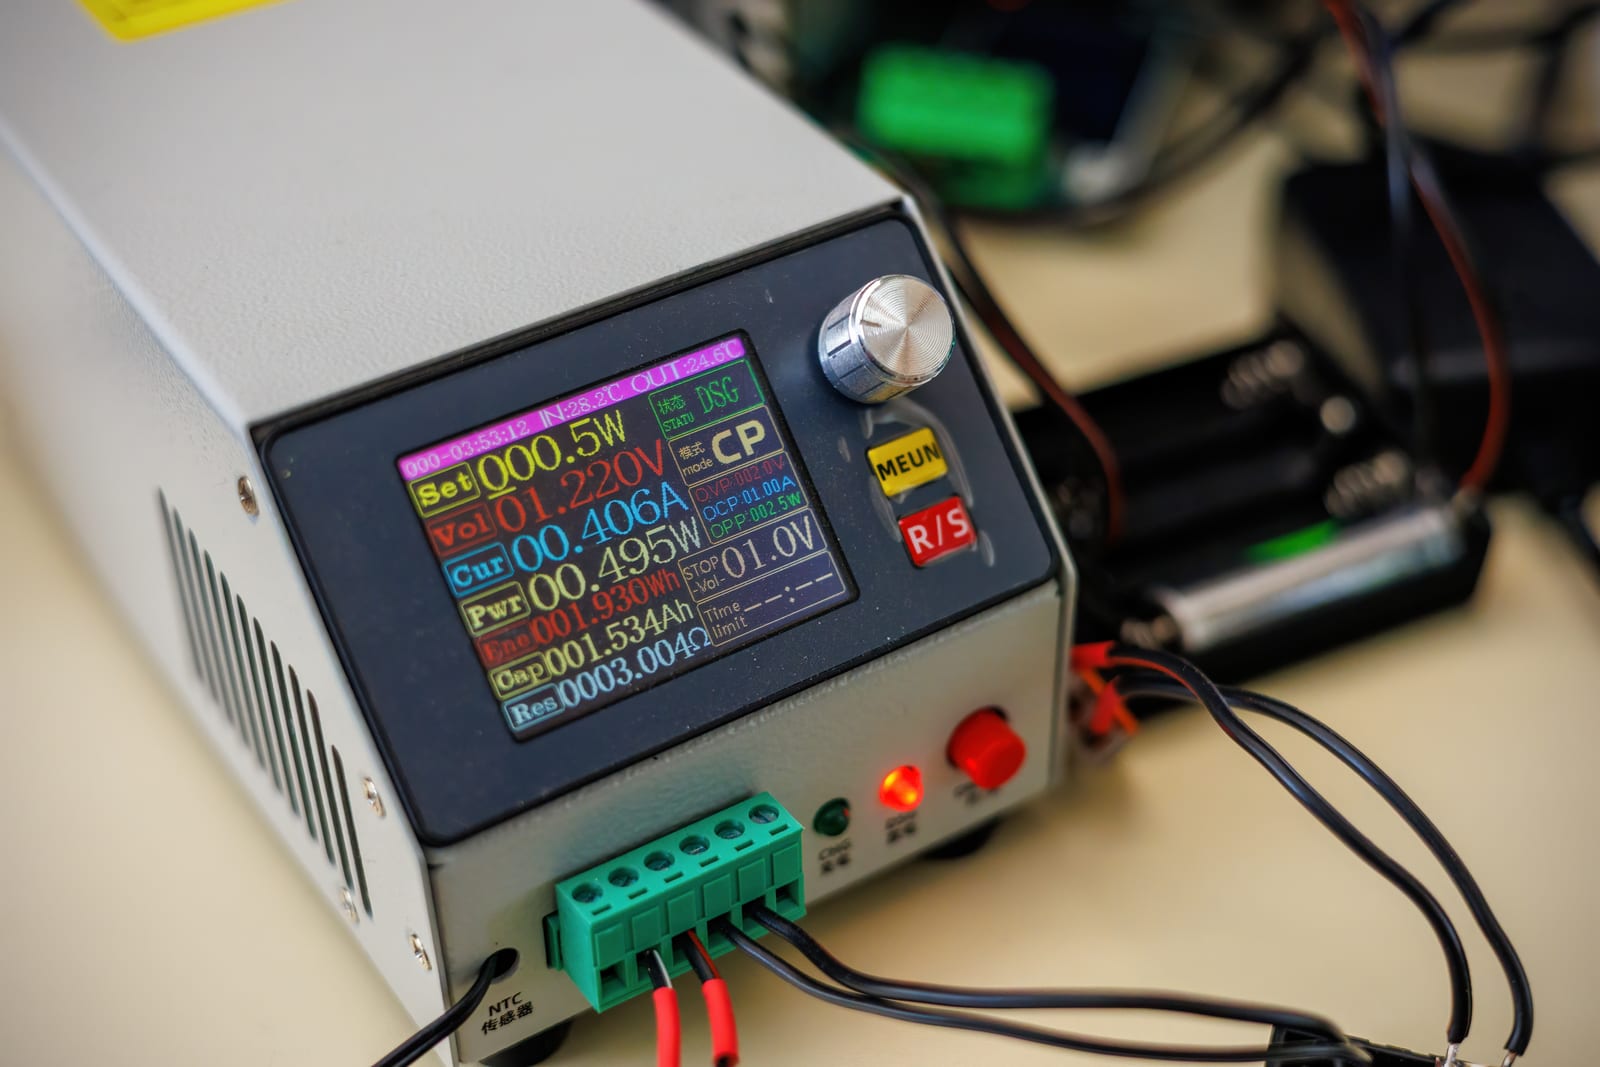
Now the important part: when we measured trail cameras’ draw, we found they behave more like a constant-power load than a constant-current one. In other words, the camera asks for the same power in watts regardless of what voltage the set is currently supplying. That has an awkward consequence: as the voltage drops, the current has to rise to keep the power constant (power = voltage × current).
On the Browning Spec Ops Elite HP5, which we picked as a representative example, this is what it looks like in night video. The camera pulls roughly 4 W:
- At full batteries (12 V) it draws about 0.33 A.
- At the shut-off threshold (8 V) it draws about 0.5 A.
So the more drained the batteries are, the more current the camera pulls from them, precisely when they’re at their weakest. That’s why constant power is a truer model than constant current, and why we designed the lab load that way too. (To be fair: this is our measurement on the HP5 and similar modern models, not a universal law that holds for every trail camera on Earth.)
More about the camera itself is in our Browning Spec Ops Elite HP5 Ultra review.
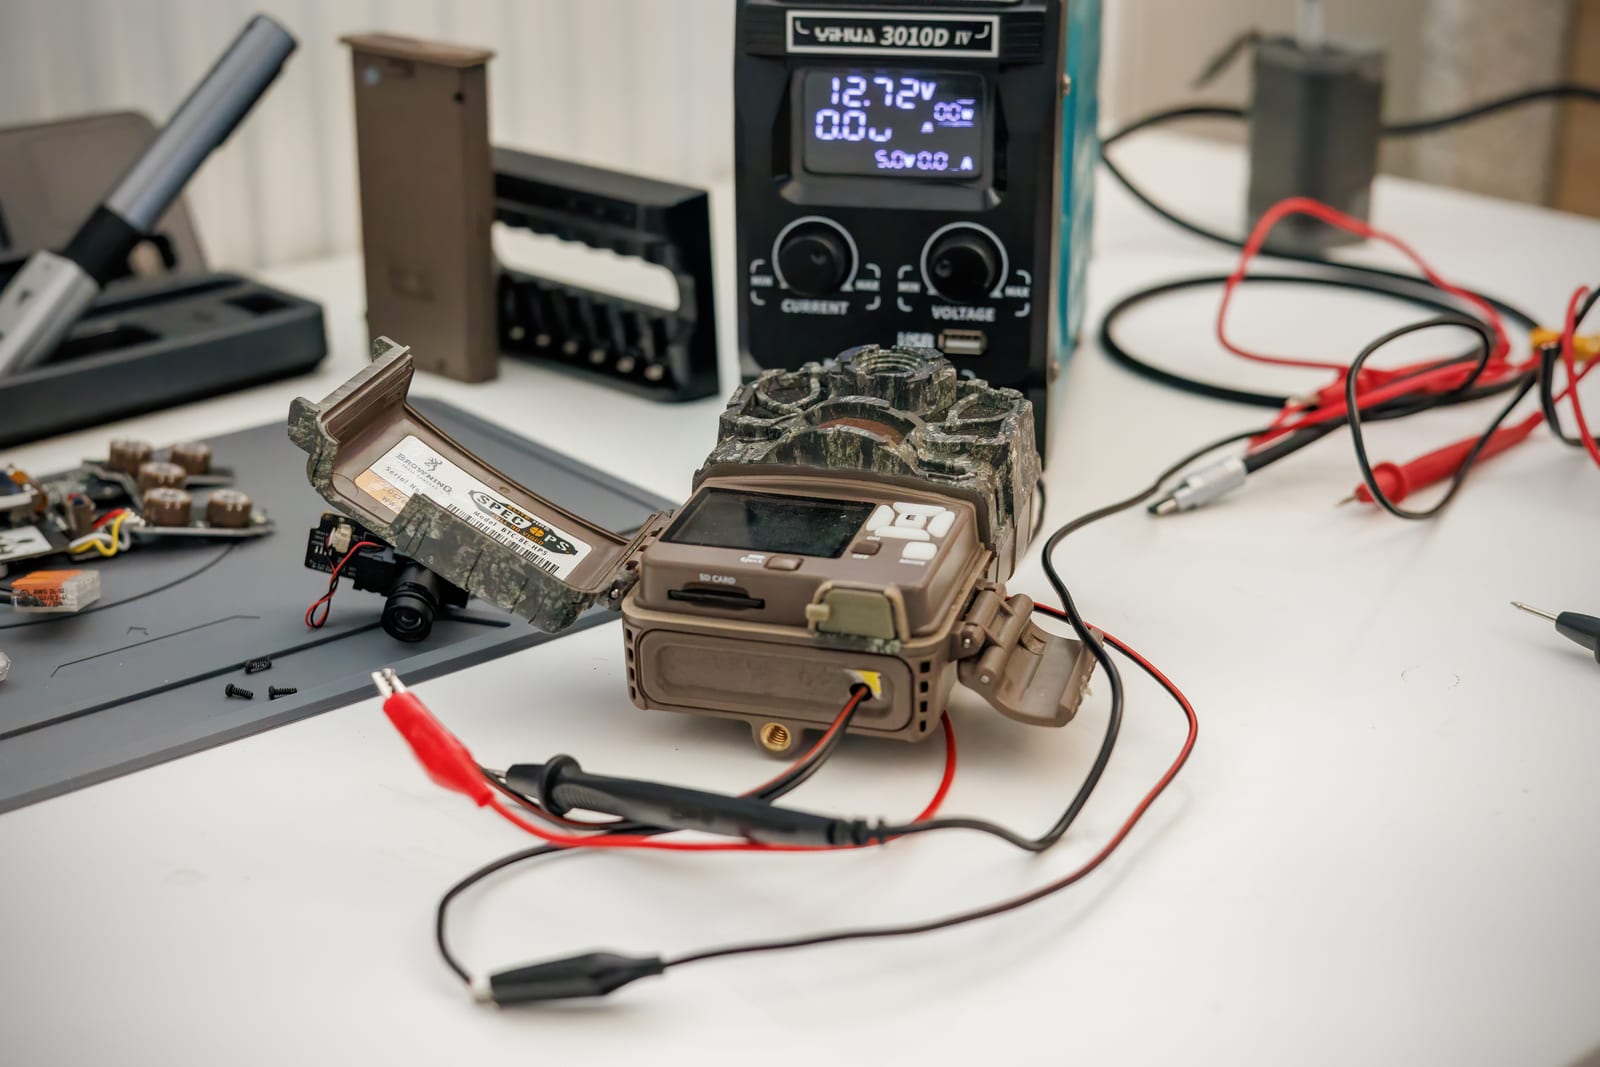
How we measured the camera’s draw
We didn’t make up the lab load settings out of thin air. We derived them from a trail camera’s real consumption.
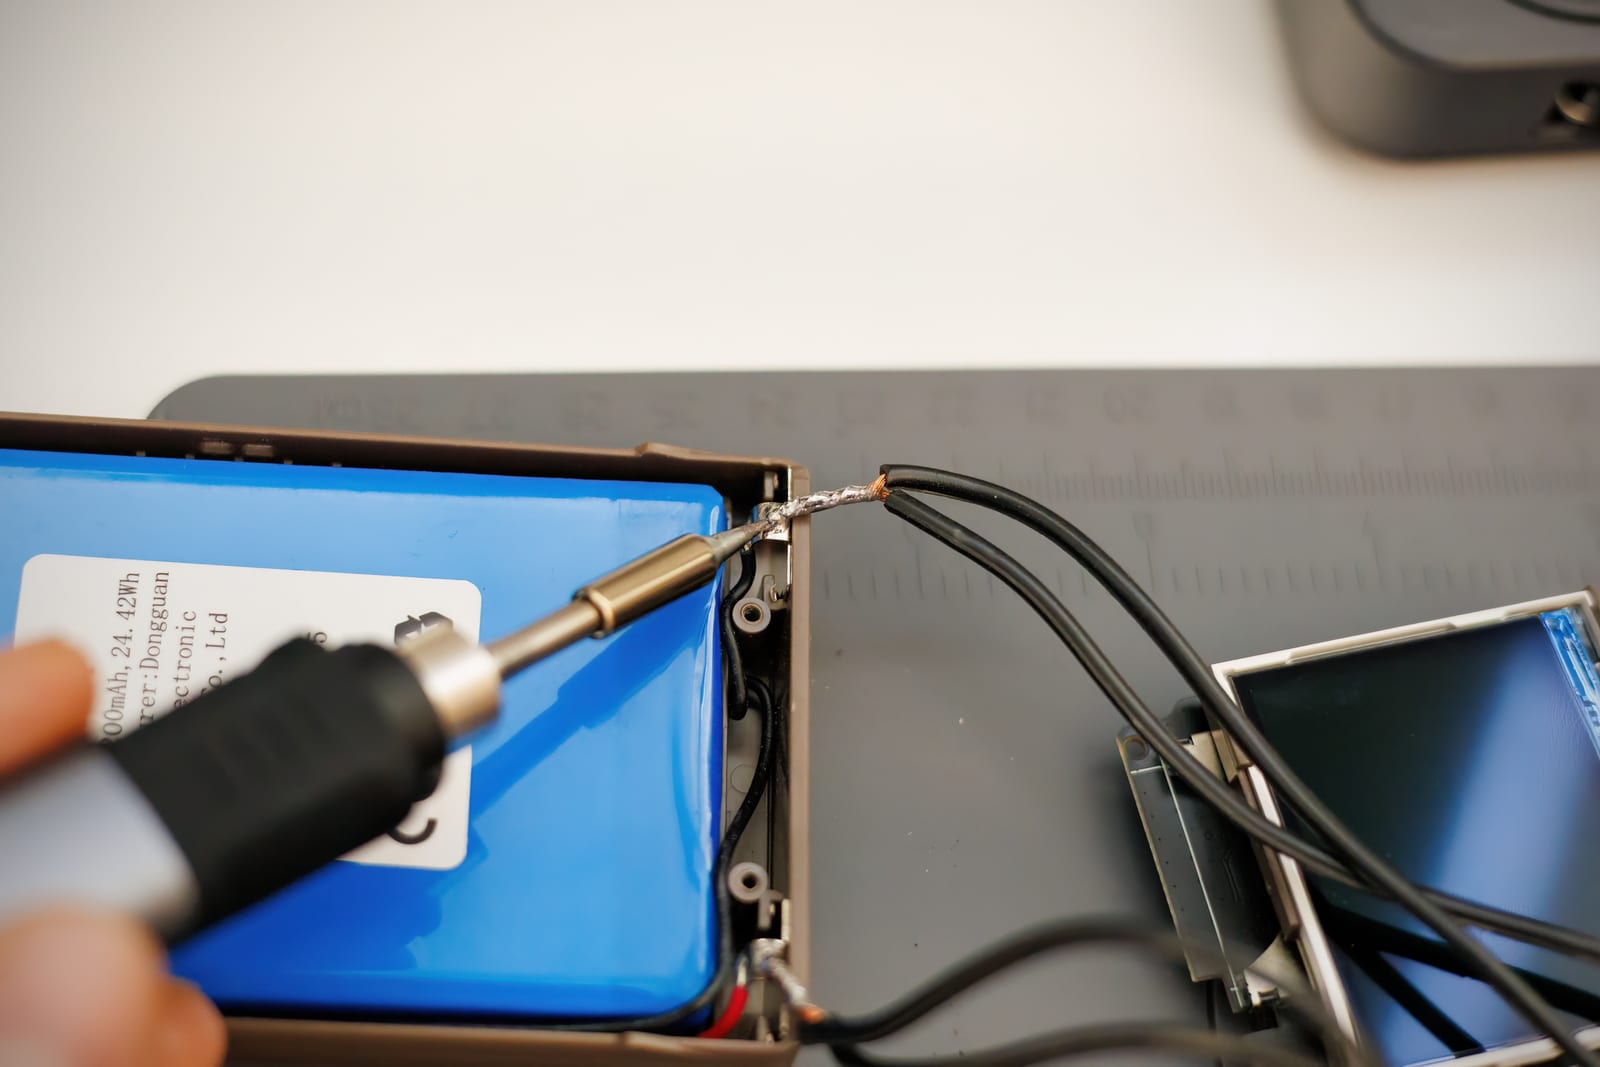
We took apart a Browning Spec Ops Elite HP5 and wired it to a lab power supply so we could measure its draw in each mode: standby, when the camera “sleeps” and waits for motion to trigger it; daytime video capture; and nighttime video capture. These are three completely different load states, and the highest draw is night video with IR illumination. We chose that as the reference for the whole test.
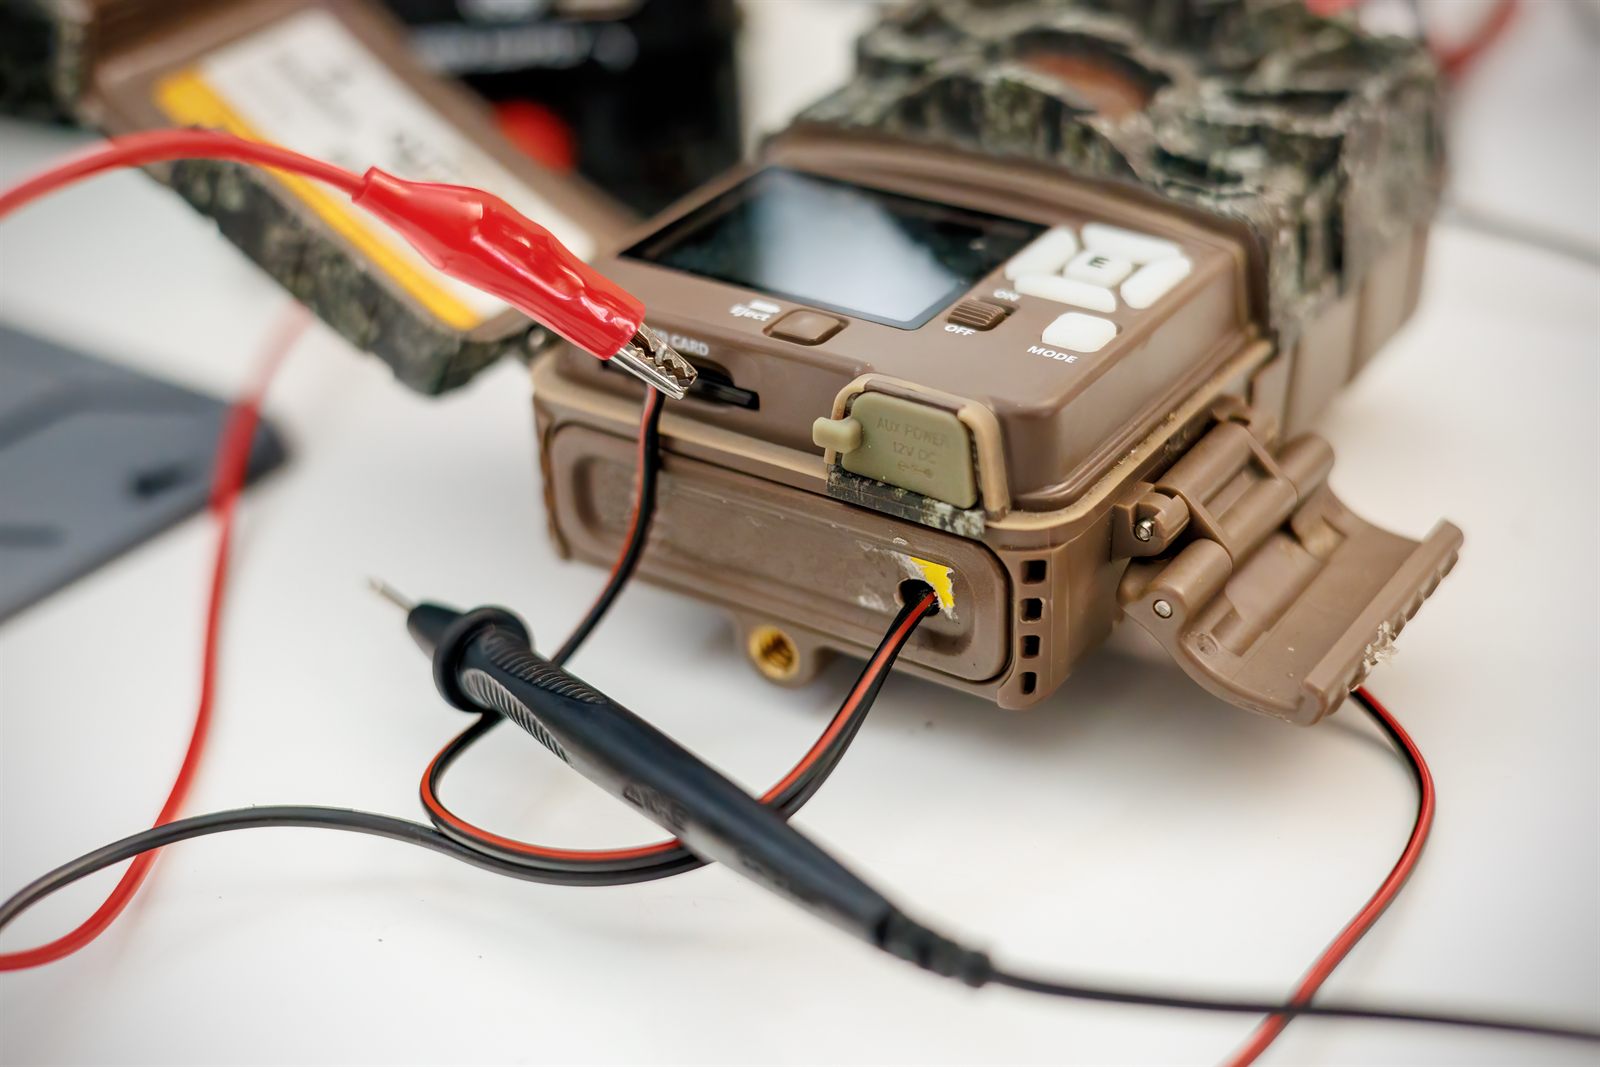
We wired the HP5 to a lab power supply and measured its real draw in standby and during day and night video.
In practice, we often see a draining camera collapse exactly while recording night video. That shows up as clips that are shorter (often just 1-2 seconds), much darker (because the IR illumination can no longer shine as it should), or simply corrupted on the card, because the camera shut off before it could save the file properly.
Measured HP5 figures:
| Mode | Power | Note |
|---|---|---|
| Standby / sleep | 0.0008 W | camera on, waiting for the PIR (0.82 mW); ≈0.02 Wh per day |
| Playback on the display | 0.66 W | only when checking on site, negligible for a long-term install |
| Daytime video | 1.98 W | no illumination |
| Night video (max IR) | 3.96 W | with illumination. Highest draw, the reference for the test |
This is where the methodology lined up nicely. 3.96 W across eight cells works out to 0.495 W per cell, so practically exactly the 0.5 W we set on the electronic load. Our lab profile therefore faithfully copies what a real camera does in its hardest mode, recording night video.
We treat the HP5 as a representative reference, because modern trail cameras manage power similarly. Other models may differ slightly in absolute numbers, but the physical basis of their behavior is the same, so the testing is transferable in principle to other common trail camera models too.
From draw to runtime
When we combine the measured capacity (the eight-cell set in Wh) with the HP5’s draw, we can estimate how many days one set lasts. We stress the word estimate, because average daily consumption depends on how often the camera triggers and how it’s set up. Our model below assumes a 20-second clip and 60% night triggers, which are adjustable assumptions (your real numbers will differ).
The four activity levels work out like this:
| Scenario | Triggers per day | Consumption |
|---|---|---|
| Quiet spot | 4 | ≈0.090 Wh/day |
| Normal spot | 10 | ≈0.20 Wh/day |
| Busy spot | 60 | ≈1.08 Wh/day |
| Very busy spot (lots of false triggers) | 150 | ≈2.66 Wh/day |
And the estimated runtime of an eight-cell set in the HP5 (in days):
| Battery (Wh per set) | Quiet (≈0.090) | Normal (≈0.20) | Busy (≈1.08) | Very busy (≈2.66) |
|---|---|---|---|---|
| Energizer Ultimate Lithium (34.5) | ≈385 | ≈173 | ≈32 | ≈13 |
| XTAR AA CLR 4300 (29.3) | ≈325 | ≈147 | ≈27 | ≈11 |
| Browning pack (25.8) | ≈285 | ≈129 | ≈24 | ≈10 |
| XTAR AA 3300 (24.7) | ≈275 | ≈124 | ≈23 | ≈9 |
| AlzaPower (23.5) | ≈260 | ≈118 | ≈22 | ≈9 |
| Eneloop Pro (23.4) | ≈260 | ≈117 | ≈22 | ≈9 |
| GP ReCyko silver (23.2) | ≈260 | ≈116 | ≈21 | ≈9 |
| Eneloop white (18.7) | ≈210 | ≈94 | ≈17 | ≈7 |
| GP ReCyko Pro (17.9) | ≈200 | ≈90 | ≈17 | ≈7 |
| Varta alkaline (9.9) | ≈110 | ≈50 | ≈9 | ≈4 |
| Lidl alkaline (9.7) | ≈110 | ≈49 | ≈9 | ≈4 |
The right-hand side of the table shows exactly why an energy reserve matters. At a busy spot, runtime drops to roughly a month even with the best set of batteries, and alkalines last only about nine days. On a frequented trail or by a wallow, where false triggers from wind and grass add to animal movement, it’s tougher still: even the best set barely lasts two weeks, and alkalines only a few days. That’s the difference between a set you swap once a season and a set you come back for every other week. Even then, the camera is usually already dead and you’re losing footage.
Once more, to be safe: these numbers are estimates under stated assumptions, not measured field runtime. Your own numbers will differ depending on activity and settings.
Lab methodology: how we discharged the cells
We wanted to measure real energy under conditions we could repeat exactly, for maximum accuracy, but also so we could test future models the same way and keep the figures comparable.
We discharged the cells on an electronic load, which imitates a trail camera but lets us control the run precisely and record the energy actually delivered. Three parameters were decisive:
- Form of the draw: constant power. The electronic load continuously recalculates the current from the cell’s present voltage so that power stays constant. This matches how a trail camera behaves (we explained it above in the physics section).
- Size of the draw: 0.5 W per cell. The HP5’s night illumination pulls ≈4 W; split across eight cells that’s 0.5 W per cell. The lab load therefore sits on the camera’s hardest real mode.
- Cut-off voltage: 1 V per cell. Below that voltage, deep discharge starts to harm cells, especially rechargeables. Better trail cameras therefore shut off on their own; on the HP5 we measured shut-off at ≈8 V, which is exactly 1 V per cell. It’s also the standard, safe floor for both NiMH and regulated Li-ion AA cells, so the test doesn’t push cells into harmful over-discharge.
To rule out chance and a faulty unit, we measured every type four times: two physical units on two different electronic loads. If one cell underperformed because of a manufacturing fault, the other three would reveal it. We fully charged every rechargeable cell before each measurement, so we measured its real capacity, not leftovers from a partial charge.
We measured using the four-wire (4-wire) method. During discharge, the working current is drawn while the cell’s present voltage also has to be measured. If both ran through the same two wires (2-wire), the voltage drop across the wires and contacts would add to the measured voltage and skew the result, especially the cut-off and the energy counted. So we run two pairs of wires to the cell: one carries the working current, the other, practically current-free, measures the voltage directly at the cell terminals. Thanks to that, our voltage figures, and therefore the capacity in Wh, are considerably more accurate and unaffected by wire resistance.
The Browning pack is the exception in our test, but we wanted to compare it too, because it’s a very interesting newcomer that many people (us included) are weighing up. It isn’t eight AAs but a single 3S Li-ion unit (nominal voltage 11.1 V, 12.5 V fully charged). So it was the only one we tested at the full 4 W with an 8 V cut-off, because that’s exactly where the camera disconnects and the pack likely also protects itself with its own cut-off. Without that adjustment, the pack couldn’t be compared fairly with the tray of eight AAs it replaces.
The whole test ran at room temperature around 23 °C. Cold is a separate topic.
Six stories behind the numbers
Every one of these numbers has a story the wrapper won’t tell you.
Energizer Ultimate Lithium wins across the board. The single-use king. At 4.31 Wh it delivered about 18% more than the best rechargeable and around 3.5× the alkalines. It ran for 519 minutes, and its fresh 1.81 V keeps the IR illumination bright deep into the discharge. That runtime costs more and it’s single-use, but for a critical spot it has no rival.
XTARs have the most energy of the rechargeables, yet are the least honest on the wrapper. They delivered 81 to 85% of their rated mWh, and there’s a technical reason. Inside an XTAR there isn’t an ordinary cell but a small ≈3.6 V Li-ion cell plus an electronic step-down (buck) converter that drops the voltage to a constant 1.5 V. The number on the wrapper is the energy of that internal cell before losses in the converter. The converter is around 90% efficient and drops at higher draw, so what reaches the terminals is typically 80 to 90%. What we measured is therefore the expected result of physics, not a fault. XTAR could choose whether to print the theoretical value before losses or the real one after losses, and it picked the more marketable version. None of that changes the fact that it still posted very good figures.
Among NiMH, a cheaper cell beat the premium model. AlzaPower (2.94 Wh) edged out Eneloop Pro (2.92 Wh) and was the most honest cell of the whole test, delivering around 98% of rated mAh. More expensive doesn’t automatically mean more energy.
Among alkalines, the brand didn’t decide it. Varta and Lidl came out practically the same (1.24 vs 1.22 Wh), and both sank to around 46% of their rating under the night load. The reason is in the chemistry: an alkaline cell has high and rising internal resistance. Under our 0.5 W load, the voltage drops fast, the cell hits the 1 V floor sooner, and a large part of its “resting” capacity goes unused. At a light load the figures would be much better, but night video with illumination is not a light load. That’s why we don’t recommend cheap alkalines for night video.
One result didn’t add up at first, and that’s exactly why we measure more than once. With the GP ReCyko in the silver version, one set of measurements came out unexpectedly low. That kind of deviation is the reason we re-measure every type repeatedly on several units: the gap from the other measurements made us go back to the raw data and repeat the test. It turned out it wasn’t a weak battery but a mistake on our side (probably units that weren’t fully charged before measuring). After repeating, the GP delivered around 91% of its rated capacity, the figures we expected. Take it as a demonstration of why careful measurement beats judging by eye.
The Browning pack is about convenience, not record capacity. It delivered 25.8 Wh for the whole pack, above its rating. The eight best AA cells beat it on raw energy (34.5 Wh for the Energizer, 29.3 Wh for the XTAR AA CLR 4300). 25.8 Wh still gets you weeks to months (depending on the spot and settings), and in practice it’s the most convenient to swap. You change the whole battery built into the tray, instead of clicking 8 AA cells in and out.
Compared with our 2022 field test, the difference is clear: back then we measured days in the camera, now energy on a lab load. The conclusions complement each other, and the order of the chemistries holds.
What the discharge curves show
The Wh figure tells you how much energy a cell delivers. The shape of the discharge curve tells you how the voltage behaves while it does so, and that’s exactly what drives the battery indicator in your trail camera.
Each chemistry has a different curve:
- Alkalines fall off gradually. The voltage drops smoothly from a fresh ≈1.5 V. As the MnO2 is used up, the internal resistance rises and the voltage keeps falling. For the indicator, that’s good news in a sense: it roughly tracks the state of charge. The catch is that the camera hits its shut-off threshold while the cell still holds energy it could deliver at a light load, but no longer under the night illumination.
- NiMH hold a fairly stable voltage. Under load, they drop to somewhere around 1.2 V for most of the discharge and fall off at the end. The voltage is lower and stable, which has one practical consequence: if you select alkaline batteries in the camera’s menu, it will show a falsely low charge percentage with fully charged NiMH. So we recommend always setting the correct battery type in the camera’s menu (if the model allows it).
- Regulated XTARs hold an almost perfectly constant ≈1.5 V and then drop sharply. The internal converter keeps the output steady for most of the capacity; some models step the voltage down to ≈1.1 V at the end as a warning to the camera that the cell is nearly empty, then go to zero. Excellent for runtime, treacherous for the indicator: the camera will show a full state almost the whole time, and only near the end of the capacity will it start dropping to minimum. In practice, it’s good to know this and to swap XTARs for charged ones at every visit, regardless of how many percent or bars the camera shows.
- Single-use lithium holds a high, fairly stable voltage and falls off only at the very end of its life.
The practical takeaway is simple. A flatter discharge curve (XTAR, NiMH) is great for runtime and for the ability to deliver energy, but it breaks the battery indicator in the camera, because the camera can’t read the falling state of charge well. So with these cells, don’t go by the bars. Rotate sets on a schedule.
How the voltage behaves during discharge

Typical discharge-curve shapes by chemistry (illustrative). It’s exactly the flat profile of XTAR and NiMH that “breaks” the battery-state indicator in a trail camera.
Is it worth paying more? The economics
The money question can’t be reduced to “buy the cheapest”. We’ll show it on the pair XTAR AA CLR 4300 versus Eneloop Pro, because that’s exactly the choice people often agonize over (prices from early June 2026).
The upfront investment comes to roughly €60 in both cases. Eight XTAR AA CLR 4300 cells cost €38 in an 8-pack, plus an XTAR L8 charger for €18, which also charges NiMH, so one charger covers both chemistries; €56 together. A set of eight Eneloop Pro runs about €40 and with a charger you’re also at roughly €60. The price difference is negligible.
Over two years you don’t buy either of these cells again. Both chemistries have far more cycles in reserve than you’ll actually use in two years (XTAR rates ≈1200, Eneloop Pro ≈500). The electricity to charge a whole set is on the order of one cent. So the entire cost difference comes down to trips into the field.
And here the XTAR has its advantage. It holds about 25% more energy per set (29.31 Wh versus 23.37 Wh), so one set lasts a quarter longer and you swap it about a fifth less often. In pure money, with normal use, that’s not much: over two years, on the order of one or two saved trips (see the table below). But the real value of that reserve is elsewhere:
- Lower risk of missed footage. You never know exactly when the batteries will run out. The XTAR’s larger reserve raises the odds that the camera is still running at your planned check, so you don’t lose footage a dead camera would have missed for good. The more remote the camera and the less often you visit, the more this weighs, far more than a few saved euros.
- In winter the gap will probably widen further. The XTAR uses lithium, and that generally holds its output in the cold better than NiMH. We can’t confirm it from this test yet (we measured at room temperature), but we expect a shift in the XTAR’s favor. Our upcoming cold-weather test will check it.
Of course, this difference only saves you money if a dead battery forces a dedicated trip. If you visit the camera on a fixed rhythm anyway, for SD cards, and both sets survive that interval, the extra 25% saves you nothing, and you pick on price or convenience (which are roughly equal). That’s exactly why the XTAR is the choice for infrequent checks and a safety margin against a flood of triggers (when an animal comes to sleep in front of the camera, or spends a long time there for some other reason), while the Eneloop is the choice for frequent checks and a focus on price.
And single-use versus rechargeable? In the table below, the Energizer looks surprisingly good at two years, because it lasts the longest and so needs the fewest trips. In practice, though, three things push it toward special deployments rather than everyday ones:
- You pay for the charger only once. Those ≈€60 for rechargeables include the charger, which you buy a single time and which serves all your cameras, so every further set costs less. The Energizer you buy again and again, and the more cameras you have, the bigger the gap, in money and in waste.
- With single-use cells you don’t know how much is left, and in practice that’s the biggest problem. You simply rotate Eneloops and XTARs on a schedule: you come by once every three to four months, take the set out, charge it at home, and put a charged one in. No risk and no waste, because you know they’ll comfortably last that interval. With Energizers, every check is a dilemma: leave them in (and risk them draining before your next visit, say during a burst of triggers, and losing footage), or swap them early to be safe (and throw away unused capacity, that is money). You can measure the voltage with a multimeter, but the flat discharge profile won’t tell you exactly how much is left, so in reality you’ll take them home before they’re truly empty, and their advantage over the table worsens.
- Waste. Every swap is eight cells in the bin (recycling, of course). On one camera it’s nothing; across large-scale monitoring it’s a pile of needless waste.
So the Energizer makes sense where it really counts: a critical, hard-to-reach spot where you fit a set for the long haul and the main thing is that the camera doesn’t fail (helped by its top cold resistance and shelf life). For everyday use, and especially dense deployment, rechargeables are cheaper, more convenient, and far kinder to nature.
Cost calculator
Enter your own prices, your own usage and your own check rhythm below, and the calculator works out what is really cheapest for you. It uses our measured Wh values and the HP5’s draw.
| Battery | Runtime/set | Sets / period | Batteries + charger | Extra trips | Total | €/Wh |
|---|---|---|---|---|---|---|
| XTAR AA CLR 4300 ✓ | ~150 days | ~5 | €62 | 5 (€100) | ~€162 | 0.30 |
| Browning A152-04 pack | ~132 days | ~6 | €61 | 6 (€120) | ~€181 | 0.28 |
| Energizer Ultimate Lithium | ~176 days | ~5 | €90 | 5 (€100) | ~€190 | 0.52 |
| Eneloop Pro | ~119 days | ~7 | €58 | 7 (€140) | ~€198 | 0.24 |
| Eneloop (white) | ~96 days | ~8 | €52 | 8 (€160) | ~€212 | 0.23 |
| Varta alkaline | ~51 days | ~15 | €68 | 15 (€300) | ~€368 | 0.45 |
The calculation is based on our measured values (at room temperature). The €/Wh column is the price of the cells divided by the energy actually delivered over the whole period, so rechargeables come out much lower thanks to their many cycles. Real runtime depends on weather, activity and settings.
Here’s a static example for normal use (≈0.20 Wh per day), an eight-cell set, a two-year horizon, and a per-trip cost of €20. We assume the case where you head out to the camera specifically to swap a dead set (so every trip is because of batteries).
| Battery | Est. runtime / set | Swap trips / 2 years | Total over 2 years* |
|---|---|---|---|
| XTAR AA CLR 4300 | ≈150 days | ≈5 | ≈€156 |
| Browning pack | ≈132 days | ≈6 | ≈€181 |
| Energizer Ultimate Lithium | ≈176 days | ≈5 | ≈€190 |
| Eneloop Pro | ≈119 days | ≈7 | ≈€198 |
| Eneloop (white) | ≈96 days | ≈8 | ≈€212 |
| Varta alkaline | ≈51 days | ≈15 | ≈€368 |
*Roughly: rechargeable = one-time hardware (a set of cells + a charger you buy once, ≈€50-60 together) + swap trips × €20. Single-use (Energizer, Varta) = batteries × number of sets + swap trips × €20, and that assumes you use each set to the full (in practice you swap them earlier, see the text). At a different per-trip cost or a longer horizon, the order changes.
The calculation is based on our measured values (at room temperature). Real runtime depends on weather, activity and settings.
Which batteries we actually use
We don’t have a universal winner for you, but clear decision rules, the way we apply them ourselves: “situation → choice”.
Maximum runtime, a critical or hard-to-reach spot, one long trip. Energizer Ultimate Lithium. We’ve had them in long-term use, they have the most energy in the whole test and hold up excellently even in hard frost. When a battery swap is a half-day expedition, the energy reserve always pays off.
High output and long-term economy. XTAR AA CLR 4300 have become our most-used batteries right now. Across the 154 trail cameras we run, that investment has definitely paid off, and they’ve proven themselves excellently in practice.
Convenience and no loose AAs. The Browning pack over USB-C, if you prefer one cell to eight AAs. The best AAs beat it on raw energy, but comfort in the field has value too.
Short deployments, photo-only mode, or emergency use. We still occasionally use single-use alkalines, but more as an exception for backup and auxiliary cameras.
The bottom line
The number on the wrapper and the energy a cell really delivers under night illumination are two different things, and the gap can be more than half. That’s exactly why we like to measure things, so we can decide on solid ground.
There’s no universal winner. Energizer Ultimate Lithium for maximum runtime and critical spots; XTAR AA CLR 4300 for the most of any rechargeable and a safety margin at remote cameras; Eneloop Pro for frequent checks and a sensible price; alkalines only for emergencies and photos. The Browning pack when you want the least possible work in the field.
If you’re still choosing a camera, start with our trail camera buying guide.
We’ll leave the cold for a separate test. We’re as curious as you are whether winter reshuffles the order.